The Impact Of Display Structures On Consumer Purchasing Behavior
You want consumers in your store. A new study on how consumers make their gardening purchases from display structures might help you find new ways to increase sales.
Over the past five years, Florida retail garden center sales have increased 91 percent. In 2000, sales were $3.6 billion and by 2005 they reached $6.9 billion. Sales figures continue to grow in 2007.
One of the reasons for such large market growth is the rise in urban sprawl. With the spread of homebuilding throughout the state, approximately 1,000 people move to Florida every day. So the demand for local plant material has soared. Identifying shopper purchasing patterns and generating consumer behavior data are important to the Florida wholesale and retail plant industries, and therefore a research project was initiated by floriculture researchers at the University of Florida.
The project involved two studies funded by the Florida Nursery Growers and Landscape Association. Study 1 investigated the influence of retail displays: a traditional bench, end cap and an island display on consumer behavior. Study 2 measured the impact containerized plants placed as display gardens have on purchases. In this article, we will discuss our research findings from Study 1, and we will discuss Study 2 in November.
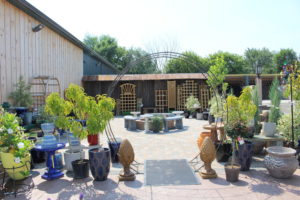
Display Benches
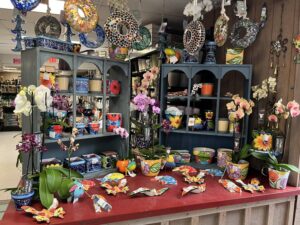
Display benches are a key component of a retail garden center as they bring plant and gardening products closer to the shopper by elevating the sales floor. Well-designed benches and displays also are important tools for increasing sales, because attractiveness of displays influences unplanned purchases as most customers have not decided on everything they will buy when they enter a retail establishment.
One display structure that promotes the impulse buy is the end-cap or end-of-aisle display. More merchandise is sold from end caps than any other display space. The amount of impulse buying or unplanned purchases has also been linked to a greater number of end caps used in stores. An example of this phenomenon is the amount of impulse buying done at supermarkets it is estimated that at least half of the purchases made there are impulse buys.
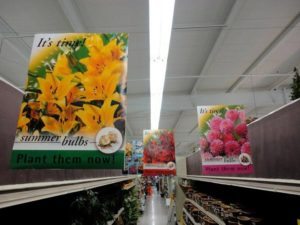
Signage
To achieve an attractive display, signage also must be included. Signs help educate the consumer by highlighting the benefits and lessening the hesitation toward buying the product. The overall goal with horticultural signage is to produce waterproof, informative, colorful signs that encourage purchases. The more information presented along with the product, the greater the likelihood of a purchase. Therefore, using the right displays with proper signage can boost sales.
Consumer Purchasing Patterns
Consumer purchasing patterns using different displays were measured on April 1, 2005, at the Emerald Coast Flower and Garden Festival on the Pensacola Junior College campus in Milton, Fla.
The event pulled in 10,000 attendees from the Florida panhandle and surrounding Gulf Coast region. A collection of 10 plant species (See Figure 1, page 62) was displayed three different ways: a traditional sales area (control), an end-of-aisle display area (end cap) and a stand-alone display unit (island display).
Each unit featured the same plant species with 10 replications displayed per species. All species were advertised by a 4×6-inch sign card containing 4-5 plant attributes and a color photograph. Consumer behavior was evaluated by video camera to capture shopping time per display. Also, a post-sale survey to collect consumer preferences and demographics was administered to customers who purchased plants from the displays.
Twelve questions were asked on the post-purchase survey including:
1. Did you learn about this retail operation through newspaper, radio, Internet, marquee/billboard, word of mouth or other?
2. Did you purchase plant material today because it was a gift, for the garden, season to plant, enjoy shopping, interior houseplant, hurricane replacement, patio plant, no reason or other?
3. Did you choose this display because it was attractive, convenient, well stocked, had to have, clean and easy to shop, well labeled, spontaneous purchase, atmosphere or no reason?
4. What drew you to the display: color combination, symmetry, signs, quality of plants, quality of display or nothing?
5. Do you think the display area affected your purchase behavior: no, somewhat or yes?
6. Are you pleased with the quality of the plants: no, somewhat or yes?
7. Gender: male or female?
8. Age: 15-24, 25-34, 35-44, 45-54 or 55+
9. Household Income: _ $10,000; _ $10,000; _ $20,000; _ $40,000; _ $60,000; _ $80,000; _ $100,000; _ $120,000; _ $140,000.
10. Education: Not a high school graduate, high school graduate, college tech graduate, 4-year college graduate, graduate degree or other.
11. Number of adults in the household.
12. Number of children in the household.
Taking The Data
Over a 4-hour period, customer shopping times at each of the three displays were recorded using a video camera. Observations of 369 customers were collected. Of the customers that shopped the different displays, their mean shopping time, in seconds, are presented in Figure 2, above. Overall, during the 4-hour period there was a similar shopping time at all three display structures. The greatest number of shoppers was found at the traditional structure, followed by island, then end-cap display.
Over the 4-hour period, information was collected on how many plants were purchased from each display; 37 plants were purchased in total. Even though the traditional bench had the longest shopping time, the highest percentage of purchases was made from the end-cap display (See Figure 3, below left).
The post-purchase survey generated 27 responses. When asked the question, “Did the display affect your purchase?” 34.5 percent said somewhat and 51.7 percent said yes. When asked the question, “What drew you to the display?” the most popular answers were 44.7 percent with quality of plants, 23.7 percent with color combination, and 18.4 percent said the quality of display. Of the respondents to the post-purchase survey, 88.9 percent were female and more than half were ages 55 or above (55.6 percent). They had an average annual household income between $40,000 and $100,000 (51.5 percent) and more than half had at least some college education (55.5 percent).
Conclusions And Recommendations
Our research shows the greatest number of customers shopped traditional display structures and plants were removed and purchased more from end-cap structures. This consumer behavior trend may indicate that quicker responses occur at end caps and that consumers may need to take more time shopping traditional structures. Retailers should consider displaying plants using a variety of display structures to increase impulse buying and unplanned purchases.
The amount of information presented on the signage should also differ depending on which structure it is displayed. With longer shopping times at traditional displays, more detailed signage can be presented. With shorter shopping times at the island and end-cap displays, signage with larger font types and more succinct text is recommended. To better understand your own customers, post-purchase surveys may need to be conducted to provide insight into their purchasing behavior.
SIDEBAR
Plant Species Displayed Per Structure
1. Quercus virginiana (Southern Live Oak)
2. Juniperus virginiana ‘Burkii’ (Burk Eastern Redcedar)
3. Cleyera ‘Bronze Beauty’ (Cleyera)
4. Ilex vomitoria ‘Bordeaux’ (Yaupon Holly)
5. Hydrangea macrophylla ‘Bailmer’ (Hydrangea ‘Endless Summer’)
6. Laguvus ovatus ‘Bunny Tails’ (Ornamental Grass)
7. Zinnia linearis (Zinnia Narrow Leaf)
8. Heuchera micrantha ‘Palace Purple’ (Coral Bells)
9. Sedum spectabile ‘Autumn Joy’ (Stonecrop)
10. Pachystachys lutea (Yellow Shrimp Plant)


 Videos